Graphical Production Planning
A production planner answers different questions over the course of a day. What is scheduled overall, where a single order is held up, what sits on a particular machine, which similar tasks can be grouped together. That is why Graphical Planning consists of several planning boards on a shared data basis, rather than one view meant to cover everything.
Production order planning
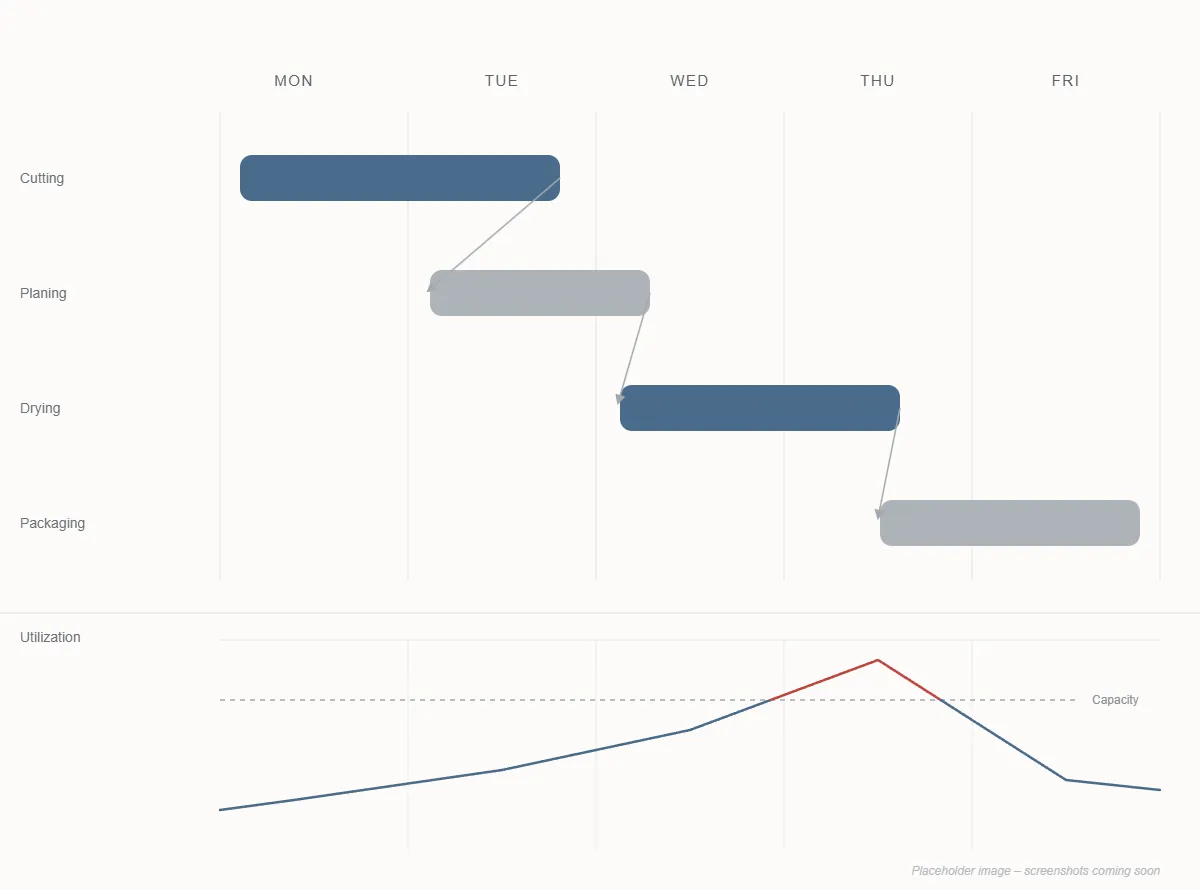
The planning board shows the production order line as the first level, with the associated operations below it. Each operation appears as a bar, color coded by status. Link lines make the relationships between operations visible, both finish-to-start and finish-to-finish.
Rescheduling works by drag and drop within the order's own row. The new start time is written back, after which allocations and curves are recalculated. Double-clicking a bar opens the production worksheet, filtered on order number and group code.
Load and capacity curves
Two curves per work center sit below the planning board. The load curve totals the daily capacity requirement from the production orders and marks overload in red. The capacity curve shows the capacity available according to the work center calendar.
When you move a bar, you therefore see not only that an order now sits on Thursday, but also that Thursday goes over capacity as a result. The curves can be expanded and collapsed, and their visibility is controlled in the settings.
Machine planning
This view lists the work centers with the machine centers below them in a hierarchy. Bars carry the order and operation number, with the description as additional text alongside. Color coding follows the order status, and link lines are colored per production order, so you can follow one order across several machines.
Here drag and drop also works across resources. Drag a bar onto a different work or machine center and the operation's assignment is updated along with the start time. The system recalculates the end from setup and run time. In case of a machine breakdown, this is how you move the order instead of creating it again.
Tooltips show order number, operation, resource, description, status, start and end, as well as setup and run time.
Planning by standard tasks
This view groups on two levels: the processing type on top, the standard tasks below. Tasks without a type are collected in a group of their own. Bars are labeled with the order number, the description sits in a separate column, and the color follows the status of the operation.
It is the right view when you think in tasks rather than in orders. Rescheduling here is horizontal only, purely in time and without changing rows.
Filters
Before a planning board opens, you select the order status and the date range. Firm planned and released orders are preselected, along with the period from each user's production planning filter. Only the operations relevant to the respective view are loaded.
Automatic planning runs
Initial automatic planning runs are implemented. They propose a schedule instead of requiring every operation to be set by hand. Integration is not complete at this stage, and the scope is being extended step by step.
Advantages:
A picture instead of lists.
Production orders, operations and their dependencies on one timeline, instead of clicking through order lines.
Dependencies are calculated along.
On every rescheduling, the system checks material stock, availabilities, due dates and capacities. Preceding and following production orders are recalculated, not just the bar you moved.
Overload becomes visible before it happens.
The load and capacity curves sit directly below the planning board and update after every change.
One view per question.
Order detail, machine occupancy and task groups all draw on the same data, without switching systems.
Reassign instead of recreate.
In machine planning you drag an operation onto another resource, and the assignment and times are adjusted automatically.
Runs inside your HIS.
No isolated tool with its own master data, but part of the system your production orders already live in.