As a sales employee, you want to better understand a customer’s purchasing behavior, for example in which item categories the most orders have been placed or how demand in certain areas has developed over the past years. The Item Categories – Statistics function in the Customer Dashboard provides a compact analysis per customer. It shows sales by item category over several years and supports you in creating targeted offers or planning assortments strategically.
Let’s take a look at how you can view and manage this information!
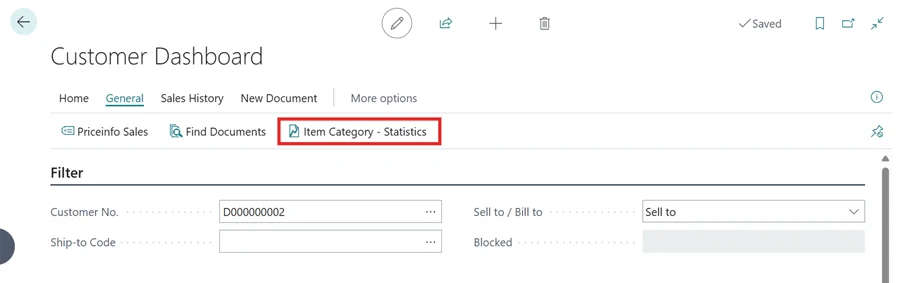
Use the search icon to open the Customer Dashboard.
Enter the number of the customer whose statistics you want to view in the Customer Number field.
In the top menu under General, click on Item Categories – Statistics.
On the page that opens, you can see sales from the last three years grouped by Item Categories. There are a few ways to customize the information shown here. Let’s explore how.
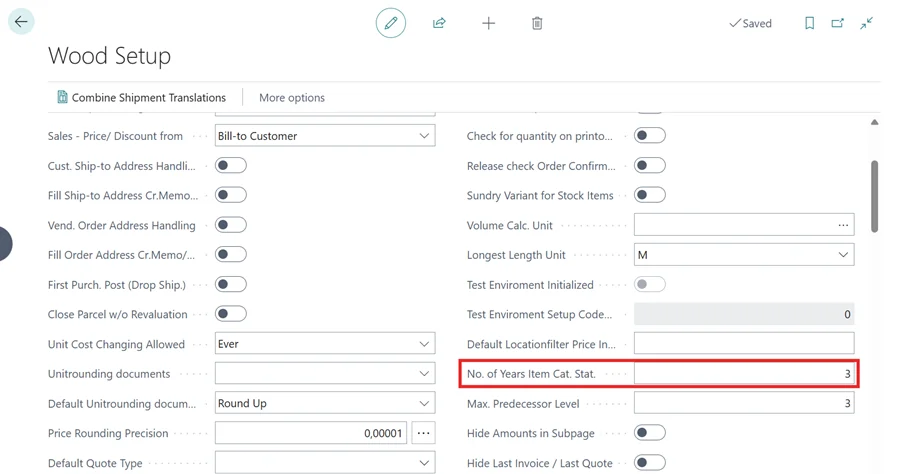
If you want to display more than three years, use search to open Wood Setup.
Find the field No. of Years Item Cat. Stat. in the General FastTab and adjust the value, for example to 5, to analyze a longer period.
To manage your Item Categories, search for Item Categories and open the page.
Here you see the existing Item Categories. To create a new category, click New.
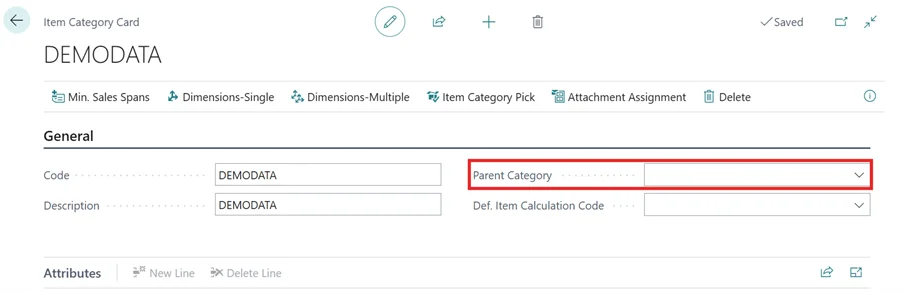
You can create multi-level hierarchies by defining a value in the Parent Code field on the Item Category Card. This creates structures such as “Consumables → Printer Supplies” where individual categories are assigned to a parent category.
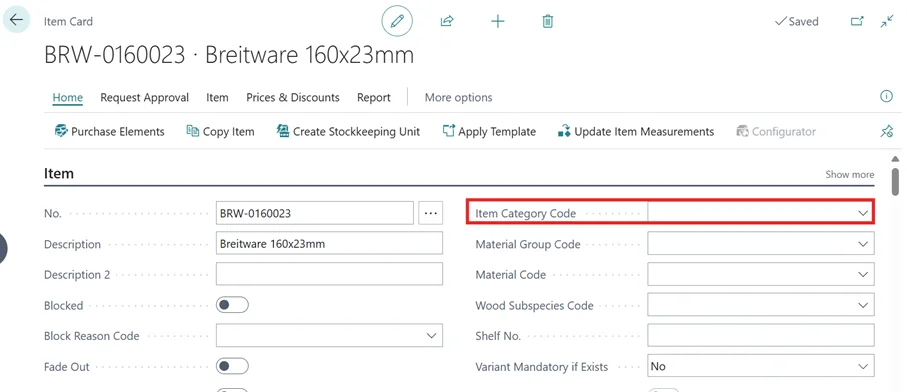
To assign an Item to an Item Category, search for Items and open the desired Item Card.
On the Item Card, under Item, find the Item Category Code field and select the appropriate Item Category.
The Item Categories – Statistics page provides a compact overview of your customers’ purchasing behavior, grouped by Item Categories and covering several years. By sensibly categorizing your Items and configuring the number of years for the analysis, you gain a valuable basis for sales decisions, targeted advising, and assortment management.