
While you’re already familiar with using Business Central’s analysis mode to quickly and repeatedly analyze data, sometimes you might want to do more, like adding a chart to better illustrate the data. Fortunately, Business Central offers a variety of standard reports you can export, such as the Customer Top 10 List, which might meet your needs.
These reports come with several standard options to enhance the exported data, but you might be looking for something extra. Let’s explore how to use a custom layout for a report!
First, let’s find the Report which you would like to customize. You can find all available Reports in Business Central by clicking on All Reports in the main menu of your Role Center or in this extensive list from Microsoft.
For this example, we open the Customer Top 10 List report.
In the window that opens, click on the Send to… button, select Microsoft Excel Document (data only) and click OK to download an Excel-file that includes all data in this Report.
Open this Excel-file to find a list with all the data. Say you would like this Report to show a Pie Chart of the total Sales per Customer and a Bar Chart of the total open Balance per Customer. You can easily create each of these, if you want in a separate Sheet, for example by creating a Pivot Table and a Chart from the information in that table.
Once you’ve set up the tables and charts you would like to have in your standard layout, save and close the file.
Now we go back to Business Central and open the Customer Top 10 List report again.
Click on the three dots after the field Report Layout.
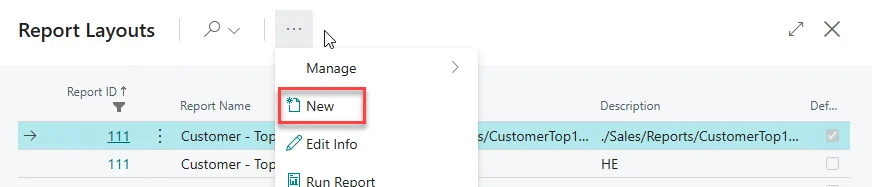
In the window that opens, click on the three dots in the top menu and on New.
Fill out the Layout Name, add a Description, and press OK.
In the window that opens drop or click to browse for the file we just created to upload it.
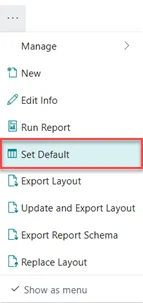
Select the line you just created and press OK.
Now, whenever you choose this layout, the data you select in the Report option window will be ready to download in this exact format. For example, you can filter the data by year or month and click on Download to open a file with the data in the same format, but with the filter applied.
For every report, you can now create a custom layout to perfectly fit your needs. This gives you a lot of freedom and flexibility, all without incurring any additional costs.
Because this is a standard Business Central functionality, there is more information available from Microsoft. Here you can easily find out more about working with Excel layouts, as well as other report layouts.